Free Access
Fig. 8
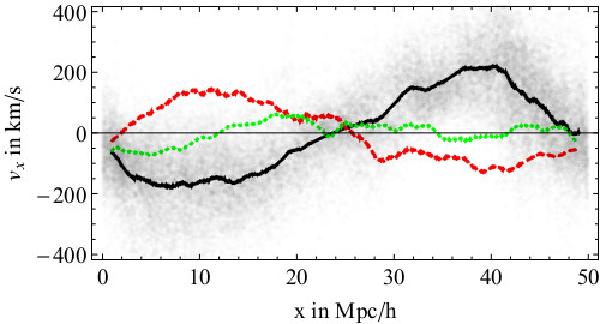
Averaged line-of-sight component of the halo velocities versus their location along the line of sight at z = 4 for three lines of sight parallel to the x-/y-/z-axis (black solid/red dashed/green dotted). To illustrate the scatter, the distribution of halos is plotted in gray for the x-axis data.
Current usage metrics show cumulative count of Article Views (full-text article views including HTML views, PDF and ePub downloads, according to the available data) and Abstracts Views on Vision4Press platform.
Data correspond to usage on the plateform after 2015. The current usage metrics is available 48-96 hours after online publication and is updated daily on week days.
Initial download of the metrics may take a while.