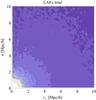
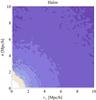
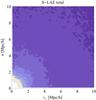
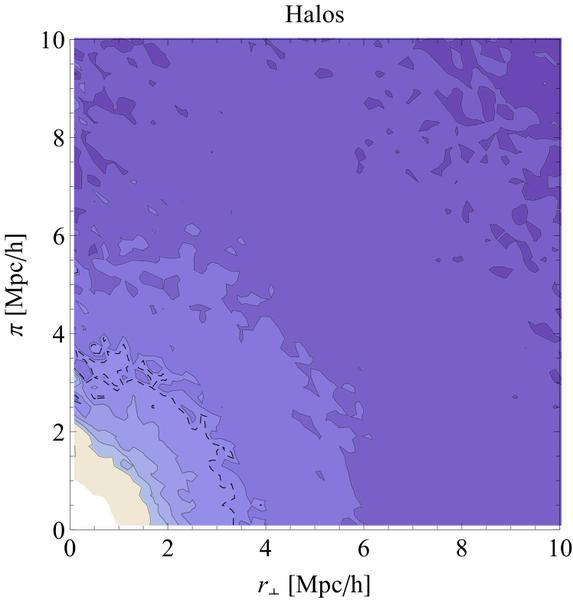
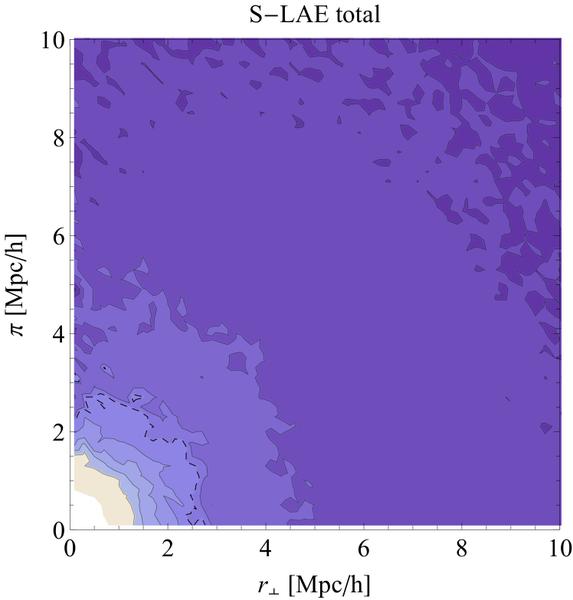
Fig. 12

2PCF as a function of line of sight (π) and perpendicular distance (r⊥) for halos (left plot), observed LAEs (middle), and S-LAE sample (right) in real space at z = 4. The dashed contours correspond to ξ = 1, contours are separated by 0.4. The number density of all threshold samples is 4 × 10⁻² Mpc-3 h3. The plots were averaged over three different lines of sight to reduce cosmic variance.
Current usage metrics show cumulative count of Article Views (full-text article views including HTML views, PDF and ePub downloads, according to the available data) and Abstracts Views on Vision4Press platform.
Data correspond to usage on the plateform after 2015. The current usage metrics is available 48-96 hours after online publication and is updated daily on week days.
Initial download of the metrics may take a while.