Fig. 2
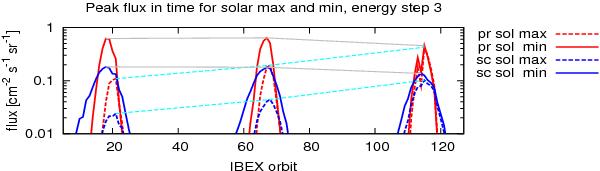
Evolution in time of the peak of energy-integrated NIS D flux at IBEX as a function of IBEX orbit number for solar activity conditions rising from minimum and declining from maximum, calculated for the primary (pr, red) and secondary (sc, blue) populations of NIS D (for parameters used, see Table 1). Solid lines show the evolution for the solar minimum conditions, broken lines for the solar maximum conditions. Pale blue dashed thin lines show the evolution of the yearly maximum of the signal when the solar activity decreases (the top line is for the primary population, the bottom for the secondary). Gray solid lines show the decrease in the signal maximum with the increase in solar activity from the minimum conditions in 2009. Because of the energy sensitivity threshold, only the peaks around orbits 20, 67, and 115 are accessible to IBEX-Lo. The “dents” are due to specifics of the IBEX spin axis pointing.
Current usage metrics show cumulative count of Article Views (full-text article views including HTML views, PDF and ePub downloads, according to the available data) and Abstracts Views on Vision4Press platform.
Data correspond to usage on the plateform after 2015. The current usage metrics is available 48-96 hours after online publication and is updated daily on week days.
Initial download of the metrics may take a while.