Fig. 8
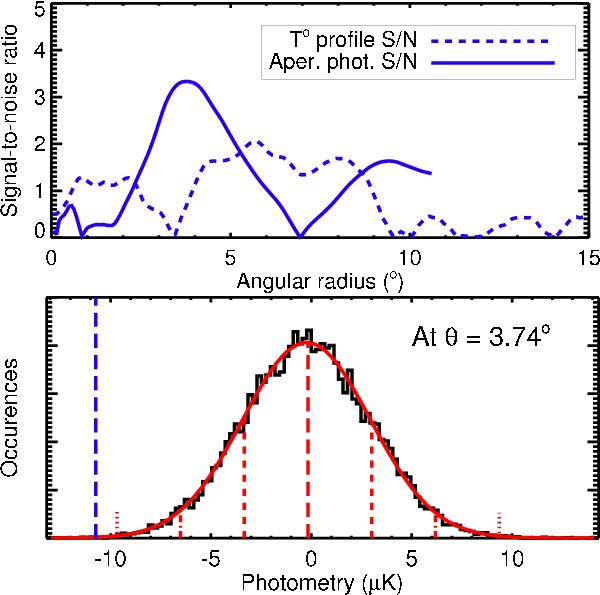
Top panel: signal-to-noise ratio (as defined in Eq. (1)) of the temperature (dashed blue) and photometry (solid blue) profiles of our fiducial stack in WMAP V CMB map. A ~3.3σ signal stands out in the photometry at a scale of 3.74°. Bottom panel: distribution of photometry values for an aperture angle of 3.74°, from 14 000 stacks of 50 random positions. The mean, 1, 2, and 3σ values are marked the same way as in Fig. 7. The blue long-dashed line shows the value obtained from the fiducial stacking. The best fitting Gaussian (red solid curved) follows closely the distribution.
Current usage metrics show cumulative count of Article Views (full-text article views including HTML views, PDF and ePub downloads, according to the available data) and Abstracts Views on Vision4Press platform.
Data correspond to usage on the plateform after 2015. The current usage metrics is available 48-96 hours after online publication and is updated daily on week days.
Initial download of the metrics may take a while.