Fig. 7
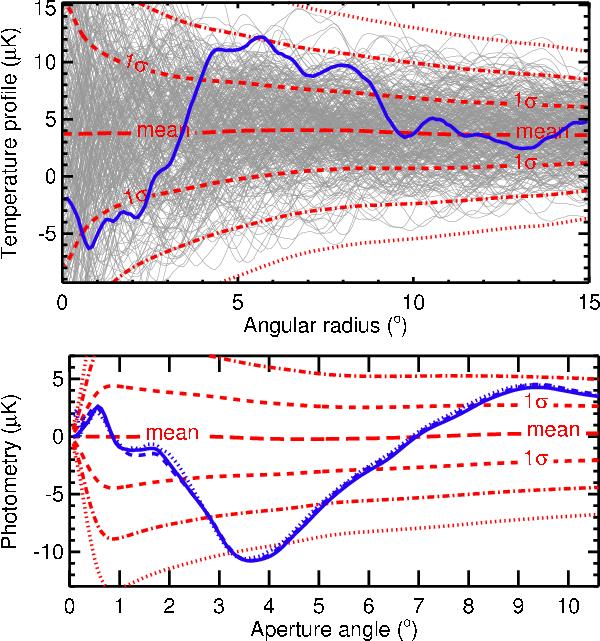
Top panel: mean profile (long red dashes) from all 14 000 random stacks and the 1σ (dashed), 2σ (dash-dotted), and 3σ (dotted) limits of the distribution of profiles. For illustration, the thin grey curves are the temperature profiles of just a few hundred stacks of 50 random positions. The blue solid curve is the result from the fiducial stacking of Gr08 voids. Every stacking here is carried out in the WMAP V CMB map, smoothed at 30.6′. Bottom panel: same legend as before for the photometry profiles. The results from the V (solid blue) and W (dashed blue) band are also shown. Similarly to Gr08, the signal from their voids stands out at more than 3σ on an angular scale of 4°.
Current usage metrics show cumulative count of Article Views (full-text article views including HTML views, PDF and ePub downloads, according to the available data) and Abstracts Views on Vision4Press platform.
Data correspond to usage on the plateform after 2015. The current usage metrics is available 48-96 hours after online publication and is updated daily on week days.
Initial download of the metrics may take a while.