Fig. 3
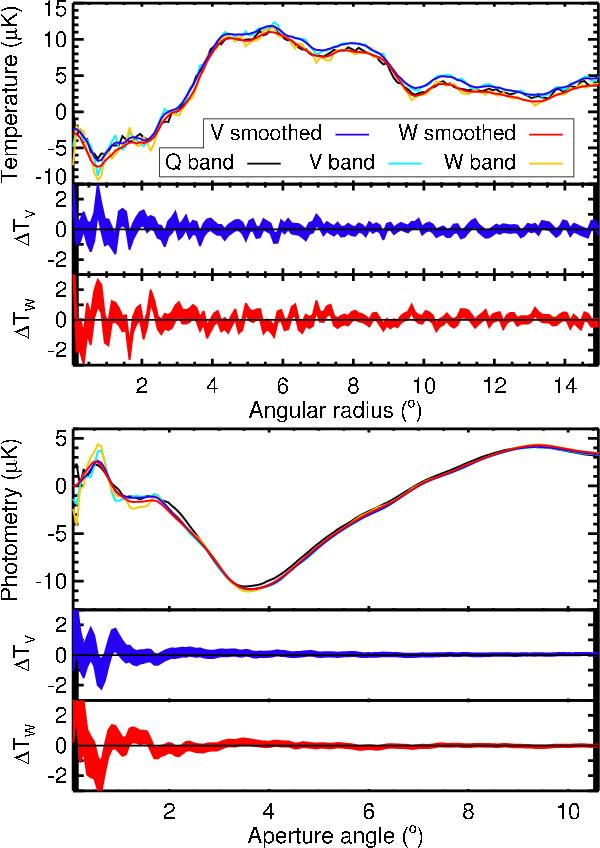
First plot: radial temperature profiles (top panel) of the stacking of Gr08 voids, done on WMAP Q, V, and W maps (both in native resolution and smoothed by a 30.6 arcminutes kernel). The differences in the profiles between the smoothed and original maps are plotted below the main plot (middle: V band; bottom: W band). The width of the shaded curves corresponds to the statistical errors on the profile measurements. Second plot: same graphs and legend as above but for the aperture photometry profiles of the stacking of Gr08 voids.
Current usage metrics show cumulative count of Article Views (full-text article views including HTML views, PDF and ePub downloads, according to the available data) and Abstracts Views on Vision4Press platform.
Data correspond to usage on the plateform after 2015. The current usage metrics is available 48-96 hours after online publication and is updated daily on week days.
Initial download of the metrics may take a while.