Fig. 13
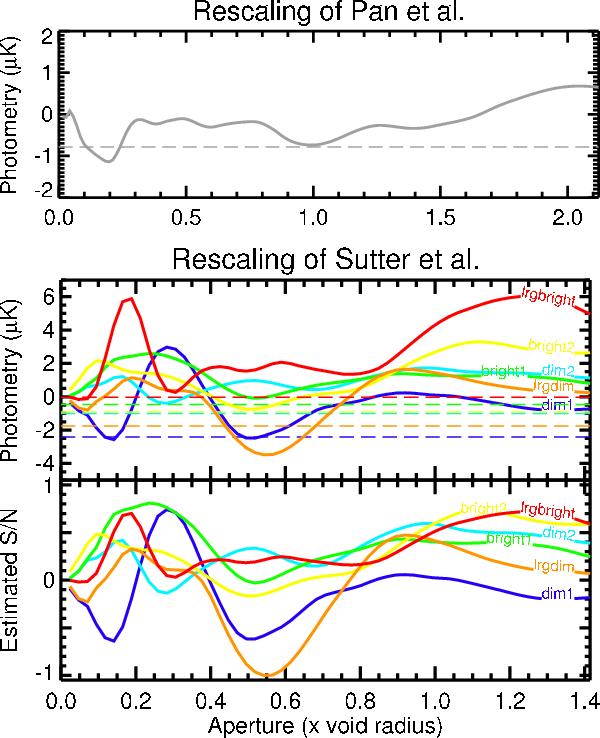
Summary of the photometry profiles extracted from the rescaled stacks of Pan et al. (top) and Sutter et al. (middle), performed in the WMAP V band cleaned map. The coloured dashed lines indicate for each sample the lowest amplitude measured in the original stacked image (without rescaling the voids). These allow to roughly estimate if the rescaling procedure did improve the detection of any previously detected signal. The bottom panel shows the previous profiles multiplied by  , with Nv the respective number of voids in each subsample. They are then normalized to the strongest signal (lrgdim). These curves provide an estimate of their potential significance as the noise in the stacked image is expected to scale as
  approximately.
Current usage metrics show cumulative count of Article Views (full-text article views including HTML views, PDF and ePub downloads, according to the available data) and Abstracts Views on Vision4Press platform.
Data correspond to usage on the plateform after 2015. The current usage metrics is available 48-96 hours after online publication and is updated daily on week days.
Initial download of the metrics may take a while.