Fig. 2
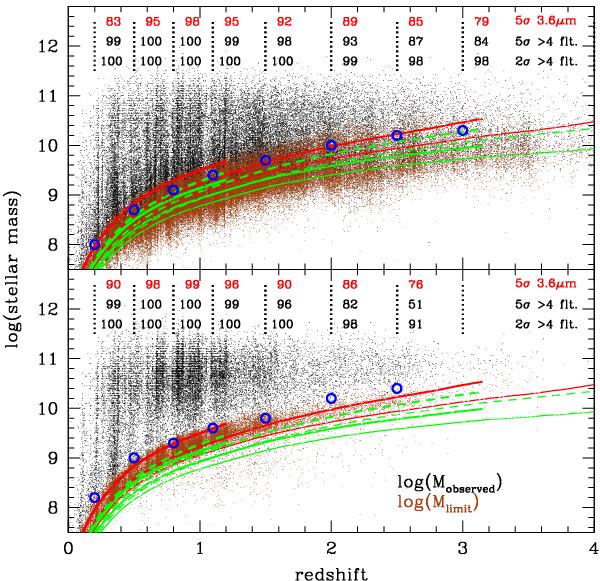
Stellar masses versus redshift for the KAB < 24 selected sample. The top and bottom panels correspond to the full sample and the quiescent population, respectively. Black points correspond to the measured stellar masses. The brown points correspond to ℳlimit which is the lowest mass which could be observed for a given galaxy for a limit at KAB = 24. The blue circles correspond to the completeness limit chosen in this study. The red and green curves correspond to the two extreme templates with τ = 0.1 Gyr and τ = 30 Gyr, respectively. We show 3 ages which are 0.9, 2 and 5 Gyr (from the bottom to the top, respectively). The dashed lines correspond to an extinction of E(B − V) = 0.2. If the lines are not drawn, it means that either the age is older than the age of the Universe or that the condition age/τ > 4 implies a small extinction. We indicate at the top of each panel the percentage of galaxies detected at 3.6 μm (top line) and in at least four bands (detection thresholds at >2σ and >5σ for the middle and bottom lines, respectively).
Current usage metrics show cumulative count of Article Views (full-text article views including HTML views, PDF and ePub downloads, according to the available data) and Abstracts Views on Vision4Press platform.
Data correspond to usage on the plateform after 2015. The current usage metrics is available 48-96 hours after online publication and is updated daily on week days.
Initial download of the metrics may take a while.