Fig. A.1
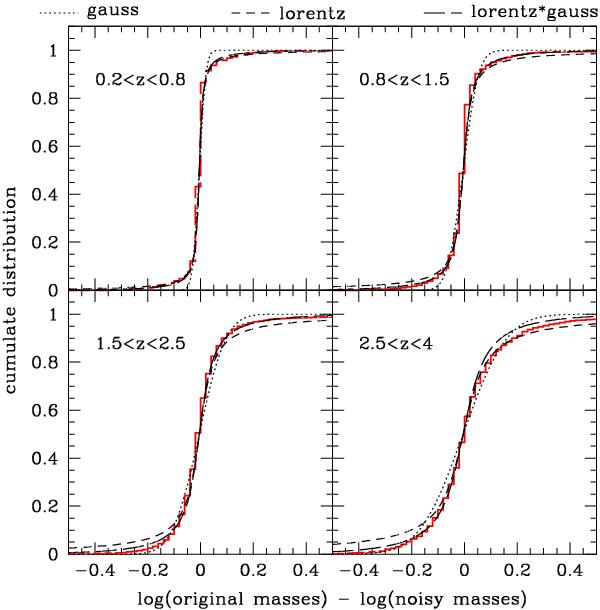
The red histogram show the cumulative distribution of the difference between the original stellar masses and the ones obtained with a “noisy” catalogues (redshifts and magnitudes are scattered according to the expected errors) at ℳ > 1010.5ℳ⊙. The dotted, short-dashed and long-dashed lines correspond to a Gaussian distribution with σ = 0.04(1 + z), a Lorentzian distribution with τ = 0.04(1 + z), and the product of a Lorentzian and a Gaussian distributions with τ = 0.04(1 + z) and σ = 0.5.
Current usage metrics show cumulative count of Article Views (full-text article views including HTML views, PDF and ePub downloads, according to the available data) and Abstracts Views on Vision4Press platform.
Data correspond to usage on the plateform after 2015. The current usage metrics is available 48-96 hours after online publication and is updated daily on week days.
Initial download of the metrics may take a while.