Fig. 13
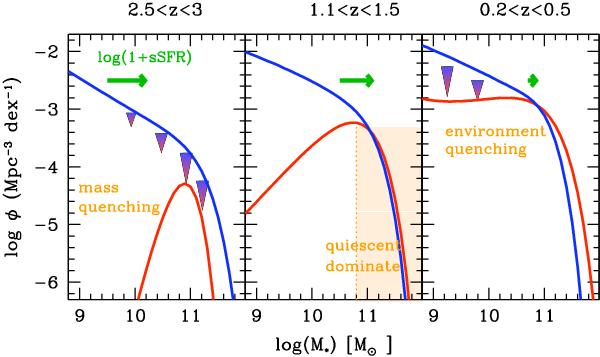
A possible scenario showing how sSFR and quenching impact the star-forming MF (blue lines) and quiescent MF (red lines), similar to Peng et al. (2010). The large arrows represent quenching. The green arrows correspond to the mass increase expected in 2 Gyr, by taking the sSFR values compiled by Stark et al. (2013). The left panel corresponds to the high redshift bin 2.5 < z < 3, where we show the mass quenching process which is more efficient at high mass. The middle panel corresponds to the redshift bin 1.1 < z < 1.5 when the quiescent galaxies starts to dominate the high-mass end. The right panel corresponds to the redshift bin 0.2 < z < 0.5, when environment quenching generates new low mass quiescent galaxies.
Current usage metrics show cumulative count of Article Views (full-text article views including HTML views, PDF and ePub downloads, according to the available data) and Abstracts Views on Vision4Press platform.
Data correspond to usage on the plateform after 2015. The current usage metrics is available 48-96 hours after online publication and is updated daily on week days.
Initial download of the metrics may take a while.