Fig. 12
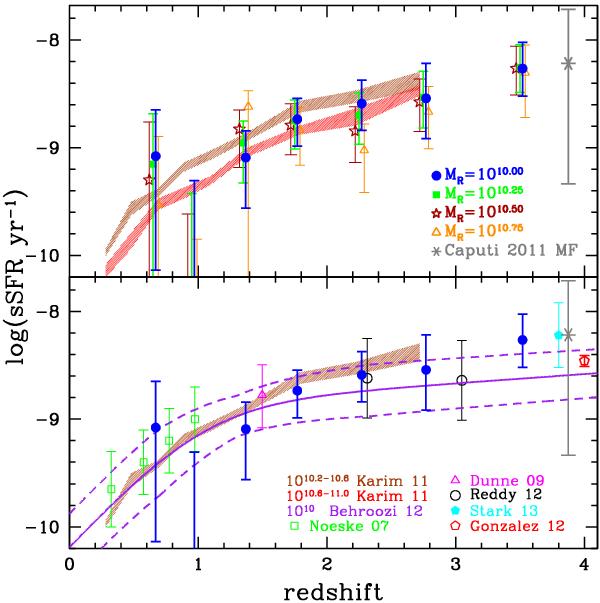
Evolution of the sSFR (SFR/ℳ) derived from the UltraVISTA mass functions. Top panel: sSFR measured at different masses using the shifts Δlog ℳ shown in Fig. 11. The sSFR computed at four reference masses ℳR = 1010, 1010.25, 1010.5, 1010.75ℳ⊙ are shown with blue circles, green squares, brown stars and orange triangles, respectively. We also added with a grey star the sSFR measured using the same method using the MF of Caputi et al. (2011). The brown and red shaded areas for Karim et al. (2011) correspond to the mass bins 1010.2 − 1010.6ℳ⊙ and 1010.6 − 1011ℳ⊙, respectively. Bottom panel: sSFR estimated at 1010ℳ⊙ compared with direct measurements from the literature. The purple solid line (dashed lines showing the uncertainties) correspond to the compilation by Behroozi et al. (2013) at the mass 1010ℳ⊙, respectively. The other points are a compilation by Stark et al. (2013) including also data from Dunne et al. (2009) and Reddy et al. (2012) at log (ℳ) ~ 9.7. The red pentagon corresponds to the Gonzalez et al. (2012) value at log (ℳ) ~ 9.7. The open green squares correspond to Noeske et al. (2007) at log (ℳ) ~ 10.
Current usage metrics show cumulative count of Article Views (full-text article views including HTML views, PDF and ePub downloads, according to the available data) and Abstracts Views on Vision4Press platform.
Data correspond to usage on the plateform after 2015. The current usage metrics is available 48-96 hours after online publication and is updated daily on week days.
Initial download of the metrics may take a while.