Fig. 11
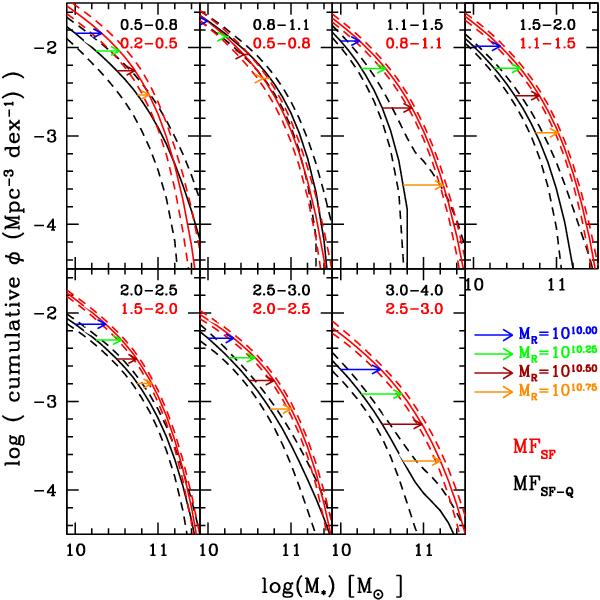
Cumulative MF of star-forming galaxies at t2 in red (lowest redshift bin) and at t1 in black (highest redshift bin). The contribution of galaxies quenched between t1 and t2 is removed from the cumulative MF at t1. The dashed lines correspond to the uncertainties. The shifts Δlog ℳ used to estimate the sSFR are shown with the horizontal arrows at four reference masses: ℳR = 1010, 1010.25, 1010.5, 1010.75ℳ⊙ in blue, green, brown and orange, respectively.
Current usage metrics show cumulative count of Article Views (full-text article views including HTML views, PDF and ePub downloads, according to the available data) and Abstracts Views on Vision4Press platform.
Data correspond to usage on the plateform after 2015. The current usage metrics is available 48-96 hours after online publication and is updated daily on week days.
Initial download of the metrics may take a while.