Fig. 9
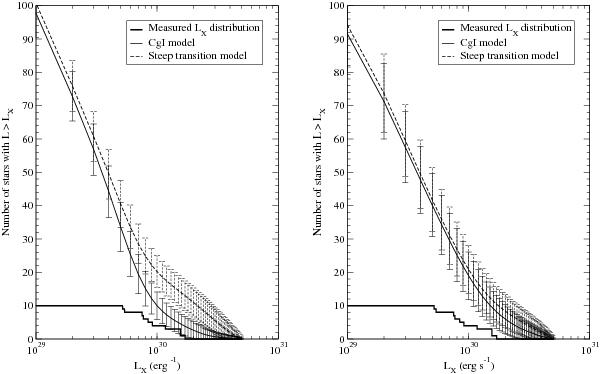
Cumulative histograms averaged over 10 000 simulations of X-ray luminosity distributions derived using the CgI model (continuous line) and the steep transition model (dashed line). The distributions of stellar X-ray luminosities around their average values are assumed to be Gaussian with a relative standard deviation of 0.5 (lefthand graph). Relative standard deviations of 1.3 for the C-sequence and the gap stars and of 4.0 for the I sequence are assumed in the righthand graph. The error bars correspond to a ±2σ accuracy. The bold line represents the cumulative histogram of measured X-ray luminosities in M 35.
Current usage metrics show cumulative count of Article Views (full-text article views including HTML views, PDF and ePub downloads, according to the available data) and Abstracts Views on Vision4Press platform.
Data correspond to usage on the plateform after 2015. The current usage metrics is available 48-96 hours after online publication and is updated daily on week days.
Initial download of the metrics may take a while.