Fig. 7
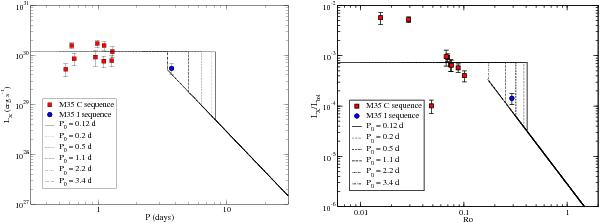
Right: X-ray to bolometric luminosity ratios of M 35 sample stars vs. Rossby numbers. Left: X-ray luminosities of M 35 sample stars vs. rotation periods. The thin black lines in both graphs represent models of X-ray activity evolution of 0.8 M⊙ stars with initial rotation periods on the ZAMS ranging from 0.12 to 3.4 days (see Sect. 5).
Current usage metrics show cumulative count of Article Views (full-text article views including HTML views, PDF and ePub downloads, according to the available data) and Abstracts Views on Vision4Press platform.
Data correspond to usage on the plateform after 2015. The current usage metrics is available 48-96 hours after online publication and is updated daily on week days.
Initial download of the metrics may take a while.