Fig. 5
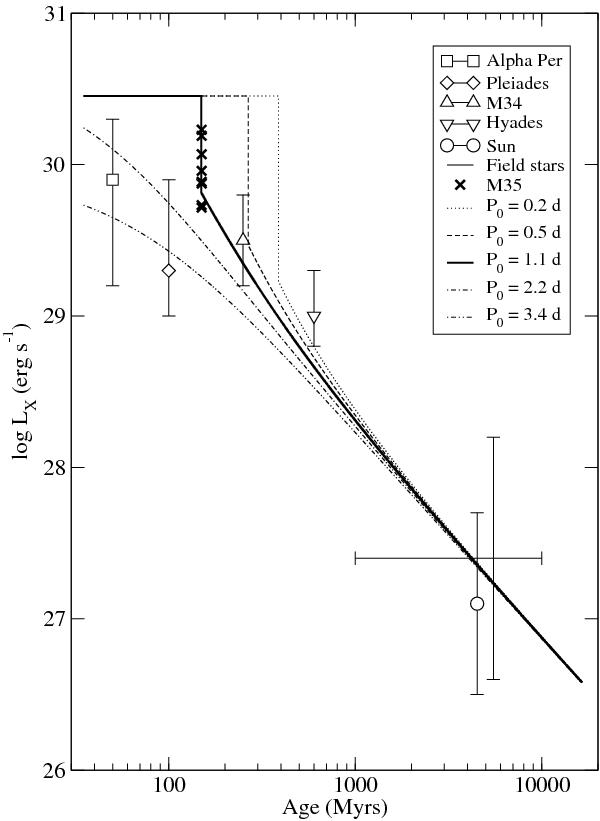
X-ray luminosity range of M 35 sample stars (crosses) with masses between 0.8 M⊙ and 1.2 M⊙ compared with median luminosities of stars with similar masses in the α Per, Pleiades, M 34, and the Hyades. The vertical error bars indicate the 25% and 75% quartiles of the distributions (Micela 2002). The various lines represent X-ray luminosity evolution models (see Sect. 5) of solar mass stars with initial rotation periods on the ZAMS ranging from 0.2 to 3.4 days.
Current usage metrics show cumulative count of Article Views (full-text article views including HTML views, PDF and ePub downloads, according to the available data) and Abstracts Views on Vision4Press platform.
Data correspond to usage on the plateform after 2015. The current usage metrics is available 48-96 hours after online publication and is updated daily on week days.
Initial download of the metrics may take a while.