Fig. 11
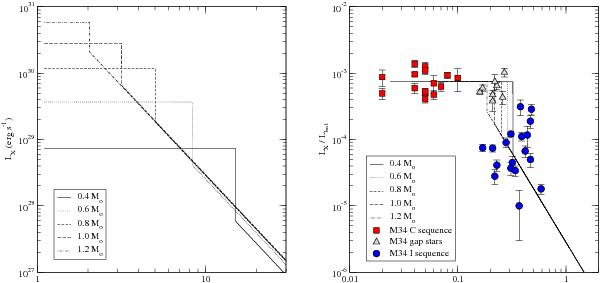
Simulations (thin lines) of the X-ray luminosity vs. rotation period (left) and of the X-ray to bolometric luminosity ratio vs. Rossby number (right) for stars with masses between 0.4 and 1.2 M⊙ having an initial period of rotation of 1.1 days on the ZAMS. Red squares, blue circles, and grey triangles represent measurements of M 34 stars (see Gondoin 2012) located respectively on the C sequence, on the I sequence, and in the gap between these two sequences.
Current usage metrics show cumulative count of Article Views (full-text article views including HTML views, PDF and ePub downloads, according to the available data) and Abstracts Views on Vision4Press platform.
Data correspond to usage on the plateform after 2015. The current usage metrics is available 48-96 hours after online publication and is updated daily on week days.
Initial download of the metrics may take a while.