Fig. 5
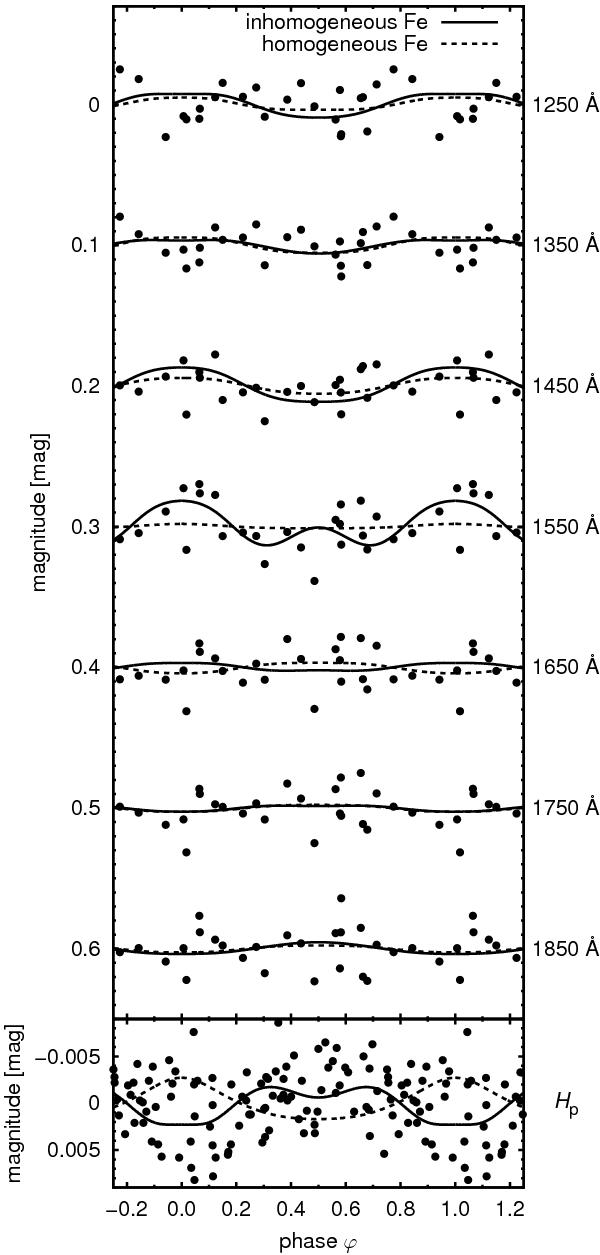
Predicted light variations of HD 64740 computed taking into account the helium and silicon surface abundance distributions after Table 5 (solid lines: inhomogeneous iron distribution after Table 5, dashed lines: homogeneous iron distribution) compared with IUE and Hipparcos observations (dots). Upper panel: the far ultraviolet region. Observed and predicted fluxes were smoothed by a Gaussian filter as described in the text. Curves for individual wavelengths were vertically shifted. The region around C iv λ1548 and λ1551 lines was excluded from the analysis. Bottom panel: the optical region in the Hipparcos Hp filter.
Current usage metrics show cumulative count of Article Views (full-text article views including HTML views, PDF and ePub downloads, according to the available data) and Abstracts Views on Vision4Press platform.
Data correspond to usage on the plateform after 2015. The current usage metrics is available 48-96 hours after online publication and is updated daily on week days.
Initial download of the metrics may take a while.