Free Access
Fig. 4
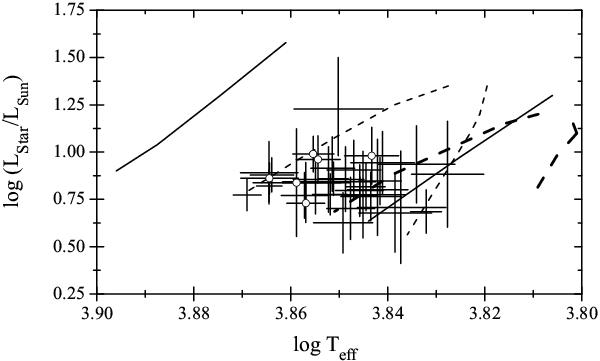
Location of 36 stars (see Table 4) and the γ Dor and δ Sct (solid lines) theoretical instability strips (Dupret et al. 2005) in the HR diagram. Dashed thin and thick lines represent the γ Dor instability regions computed with α = 2.0 and 1.5, respectively. Open circles refer to the hybrid pulsators.
Current usage metrics show cumulative count of Article Views (full-text article views including HTML views, PDF and ePub downloads, according to the available data) and Abstracts Views on Vision4Press platform.
Data correspond to usage on the plateform after 2015. The current usage metrics is available 48-96 hours after online publication and is updated daily on week days.
Initial download of the metrics may take a while.