Fig. 3
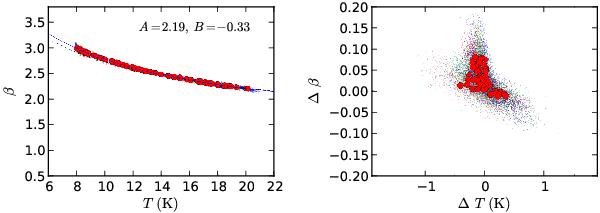
The results of the MC method for the same case as the previous figures. Left frame: MC estimates of the T and β values. The red circles show the average parameters for each source. The dots represent 1000 MCMC samples, with the colours corresponding to different sources. The dashed black line is the true β(T) relation, and the solid blue line is the estimated relation. Right frame: absolute errors in the T and β values of individual sources. The dots correspond to 1000 MCMC estimates for the parameters of each source, and the solid red circles are the average values.
Current usage metrics show cumulative count of Article Views (full-text article views including HTML views, PDF and ePub downloads, according to the available data) and Abstracts Views on Vision4Press platform.
Data correspond to usage on the plateform after 2015. The current usage metrics is available 48-96 hours after online publication and is updated daily on week days.
Initial download of the metrics may take a while.