Fig. 27
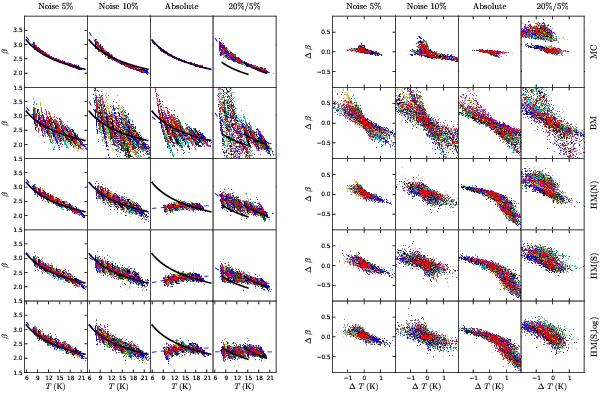
Comparison of the derived (T, β) values in the case of simulated modified black body spectra of different noise level (cf. Sect. 4). The black solid lines correspond to the relation assumed in the simulation of the observations. The measurements have 5% or 10% relative errors or the absolute errors described in Sect. 4.3. In the fourth column of frames, the observations follow two distinct β(T) relations (black solid lines) with 20% relative errors for the low temperature branch (T < 15 K) and 5% relative errors for the high temperature branch (T > 14 K). The left-hand frames show some MCMC samples (coloured dots), their averages (red circles) and the fitted β(T) relations (dashed blue lines). The right hand frames show the distributions for the errors ΔT and Δβ. The plots correspond to a single noise realisation of observations of 50 sources.
Current usage metrics show cumulative count of Article Views (full-text article views including HTML views, PDF and ePub downloads, according to the available data) and Abstracts Views on Vision4Press platform.
Data correspond to usage on the plateform after 2015. The current usage metrics is available 48-96 hours after online publication and is updated daily on week days.
Initial download of the metrics may take a while.