Fig. 22
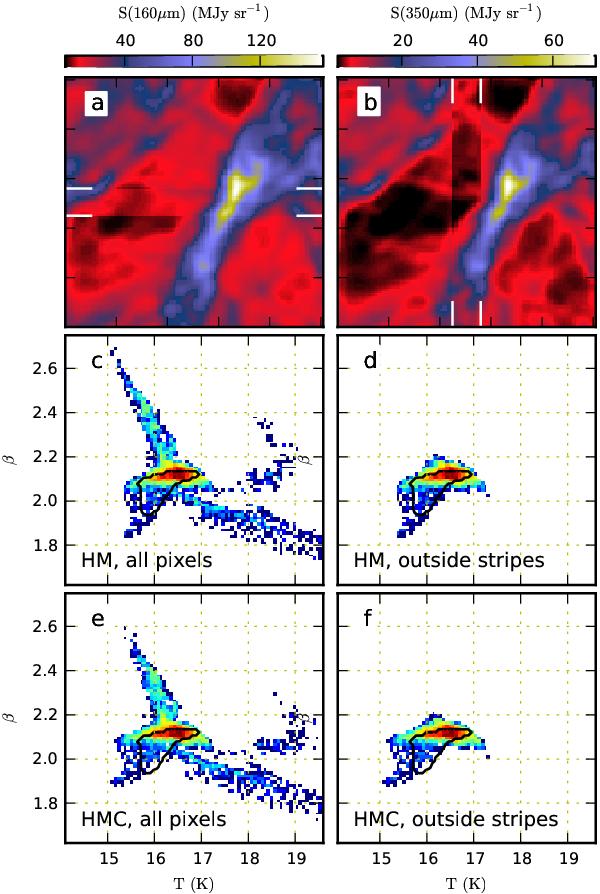
The 160 μm (frame a)) and 350 μm (frame b)) surface brightness maps (N = 0.1) that include stripes with constant surface brightness offsets. The white lines indicate the widths of these stripes. Frames c) and d) show the distribution of (T, β) values obtained with HM for all the pixels (frame c)) and separately for the pixels outside the stripes (frame d)). Frames e) and f) show the corresponding results for method HMC. The black contours correspond to the distribution of values for method HM, in the case of no stripe artefacts and no noise (see Fig. 17). In frames c–f), the colour scale corresponds to logarithmic density of pixels per a (T, β) interval.
Current usage metrics show cumulative count of Article Views (full-text article views including HTML views, PDF and ePub downloads, according to the available data) and Abstracts Views on Vision4Press platform.
Data correspond to usage on the plateform after 2015. The current usage metrics is available 48-96 hours after online publication and is updated daily on week days.
Initial download of the metrics may take a while.