Fig. 21
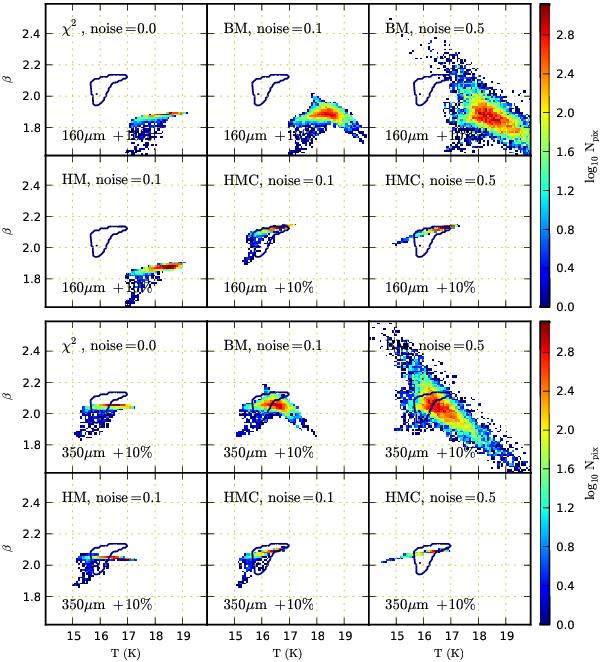
The distributions of (T, β) values for data containing calibration errors where either 160 μm data (first six frames) or the 350 μm data (six last frames) has been scaled by 1.1. The methods are χ2, BM, HM, and HMC, the last one corresponding to a hierarchical model that includes free parameters for multiplicative corrections in three bands. Each frame corresponds to one combination of method and statistical noise, as indicated in the frames. The single contour corresponds to the locus of the correct solution (see Fig. 17).
Current usage metrics show cumulative count of Article Views (full-text article views including HTML views, PDF and ePub downloads, according to the available data) and Abstracts Views on Vision4Press platform.
Data correspond to usage on the plateform after 2015. The current usage metrics is available 48-96 hours after online publication and is updated daily on week days.
Initial download of the metrics may take a while.