Fig. 20
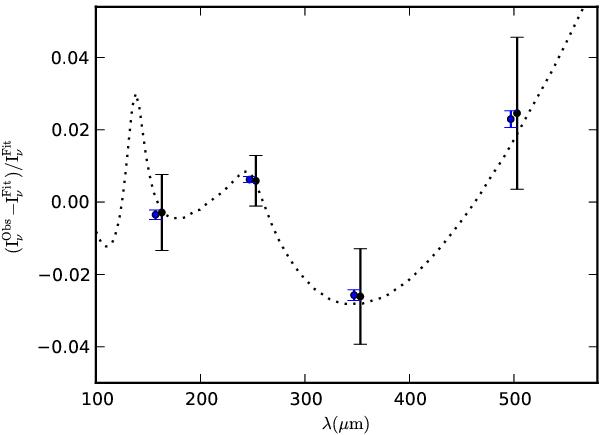
Deviations from the fitted modified black body law in the case of the MHD model. The plot shows the relative deviations for 5% of the highest (blue symbols) and 5% of the lowest column density (black symbols with larger error bars) pixels. The error bars correspond to noise per pixel for the general noise level N = 0.1. The dotted line shows relative deviations between a ν2.1 dependence and the actual opacity in the employed dust model.
Current usage metrics show cumulative count of Article Views (full-text article views including HTML views, PDF and ePub downloads, according to the available data) and Abstracts Views on Vision4Press platform.
Data correspond to usage on the plateform after 2015. The current usage metrics is available 48-96 hours after online publication and is updated daily on week days.
Initial download of the metrics may take a while.