Fig. 19
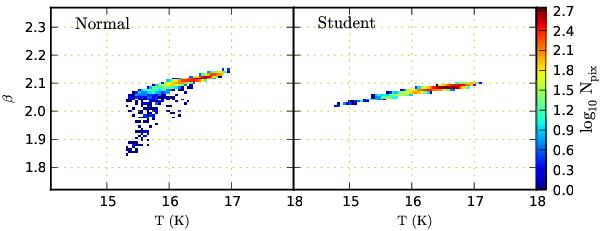
Distribution of recovered Tand β values for MHD model with noise N = 0.1 and the HM method with probabilities being calculated either with normal distribution (left-hand frame) or with Student distribution (right-hand frame). The colour scale corresponds to logarithmic number of pixels per (T, β) interval.
Current usage metrics show cumulative count of Article Views (full-text article views including HTML views, PDF and ePub downloads, according to the available data) and Abstracts Views on Vision4Press platform.
Data correspond to usage on the plateform after 2015. The current usage metrics is available 48-96 hours after online publication and is updated daily on week days.
Initial download of the metrics may take a while.