Fig. 17
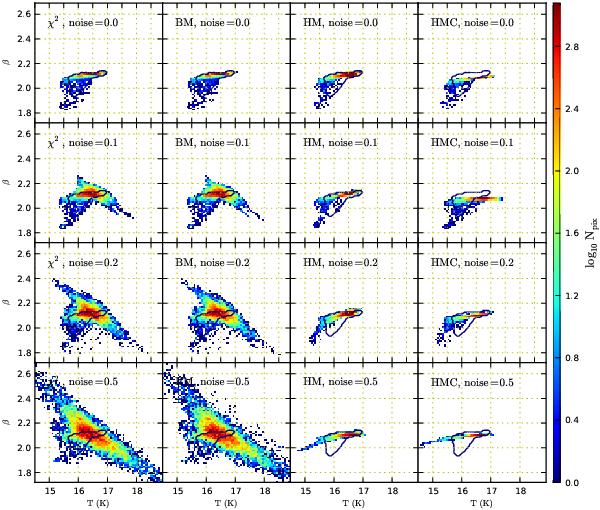
The distributions of (T, β) values for different methods (χ2, BM, HM(N), and HMC) and for the MHD model and noise levels N = 0.0–0.5. The values are the Bayesian estimates of the individual pixels.To guide the eye, a single contour following the solution for the N = 0.0 case is plotted in each frame. The colour scale corresponds to logarithmic number of pixels per a (T, β) interval.
Current usage metrics show cumulative count of Article Views (full-text article views including HTML views, PDF and ePub downloads, according to the available data) and Abstracts Views on Vision4Press platform.
Data correspond to usage on the plateform after 2015. The current usage metrics is available 48-96 hours after online publication and is updated daily on week days.
Initial download of the metrics may take a while.