Fig. 14
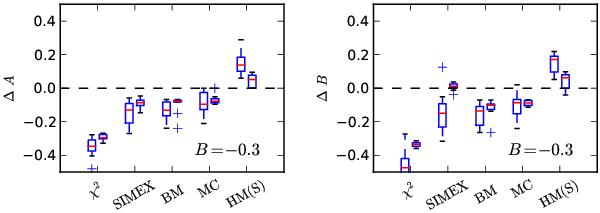
Comparison of the errors in the A and B parameters of the β(T) relation, comparing cases with 50 or 500 observed sources. The methods of analysis are χ2, SIMEX, BM, MC, and HM(S). For each method, two boxplots are shown, the 50-source case on the left and the 500-source case on the right. The observations consist of data in Herschel bands at wavelengths 100–500 μm and with a relative noise of 10%.
Current usage metrics show cumulative count of Article Views (full-text article views including HTML views, PDF and ePub downloads, according to the available data) and Abstracts Views on Vision4Press platform.
Data correspond to usage on the plateform after 2015. The current usage metrics is available 48-96 hours after online publication and is updated daily on week days.
Initial download of the metrics may take a while.