Fig. 11
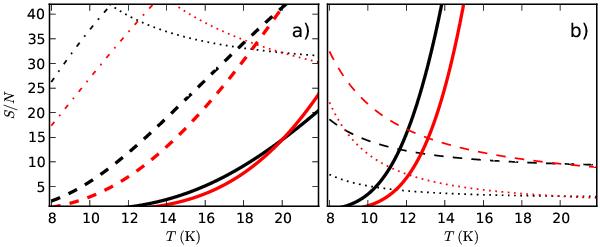
The signal-to-noise ratio of the simulated observations of Sect. 4.3 as a function of the source temperature. The left-hand frame corresponds to the simulated Herschel observations at 100 μm (solid line), 160 μm (dashed line), 250 μm (dash-dotted line), and 500 μm (dotted line). The right-hand frame shows the signal-to-noise ratios for the simulated IRAS 100 μm data (solid line) and the Planck 500 μm and 850 μm bands (dashed and dotted lines, respectively). The signal-to-noise ratio of the 350 μm observations is 40. The black lines correspond to the relation β = 2.2(T/20.0)-0.3 and the red lines to β = 2.2(T/20.0)+ 0.3.
Current usage metrics show cumulative count of Article Views (full-text article views including HTML views, PDF and ePub downloads, according to the available data) and Abstracts Views on Vision4Press platform.
Data correspond to usage on the plateform after 2015. The current usage metrics is available 48-96 hours after online publication and is updated daily on week days.
Initial download of the metrics may take a while.