Fig. 6
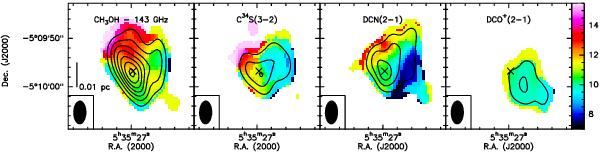
Velocity maps (colour scale, in km s-1) of each line detected with PdBI towards OMC-2 FIR 4, with overlaying contours of the corresponding velocity-integrated maps. Contour levels are as in Fig. 3. The bottom-left ellipse in each panel represents the beam size. Crosses mark the phase centre of the observations, i.e. α(J2000) = 05h35m26.971s, δ(J2000) = –05°09′56.77″.
Current usage metrics show cumulative count of Article Views (full-text article views including HTML views, PDF and ePub downloads, according to the available data) and Abstracts Views on Vision4Press platform.
Data correspond to usage on the plateform after 2015. The current usage metrics is available 48-96 hours after online publication and is updated daily on week days.
Initial download of the metrics may take a while.