Fig. 10
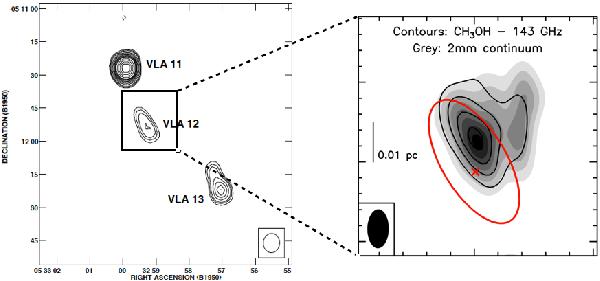
Left panel: VLA map of the 3.6 cm continuum emission in the OMC-2 FIR 4 region and its surroundings (taken from Reipurth et al. 1999). The synthesised beam is shown at the bottom-right corner. The source labelled VLA 12 coincides with the position of OMC-2 FIR 4. Right panel: close-up view showing our PdBI continuum (grey scale) and CH3OH (black contours) maps. The synthesised beam is shown at the bottom-left corner. The red ellipse schematically represents the 4σ contour of the VLA image (left panel). The red cross marks the position of the cm emission peak.
Current usage metrics show cumulative count of Article Views (full-text article views including HTML views, PDF and ePub downloads, according to the available data) and Abstracts Views on Vision4Press platform.
Data correspond to usage on the plateform after 2015. The current usage metrics is available 48-96 hours after online publication and is updated daily on week days.
Initial download of the metrics may take a while.