Fig. 1
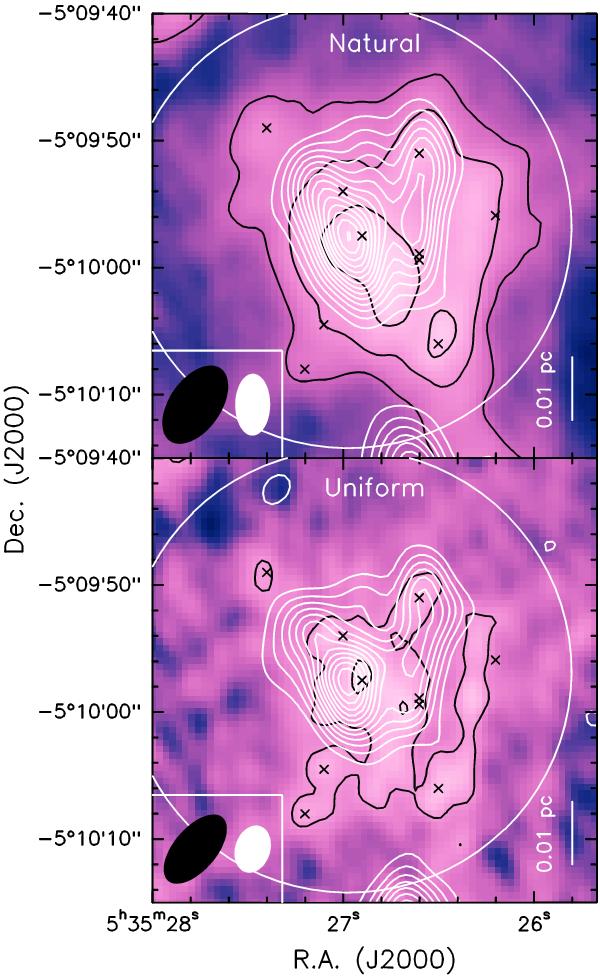
Interferometric continuum maps of OMC-2 FIR 4 with natural (top) and uniform weighting (bottom). White contours represent the 2-mm continuum emission obtained with the PdBI, while black contours, as well as the background colour scale, correspond to the 3-mm continuum emission seen with the NMA (S08). Contours for both the PdBI and NMA maps start at 3σ and increase by steps of 3σ. The bottom-left ellipses represent the respective beam sizes. The white open circles mark the primary beam FWHM for the PdBI observations. The black crosses mark the NMA 3-mm cores as reported in Table 4 of S08.
Current usage metrics show cumulative count of Article Views (full-text article views including HTML views, PDF and ePub downloads, according to the available data) and Abstracts Views on Vision4Press platform.
Data correspond to usage on the plateform after 2015. The current usage metrics is available 48-96 hours after online publication and is updated daily on week days.
Initial download of the metrics may take a while.