Fig. 5
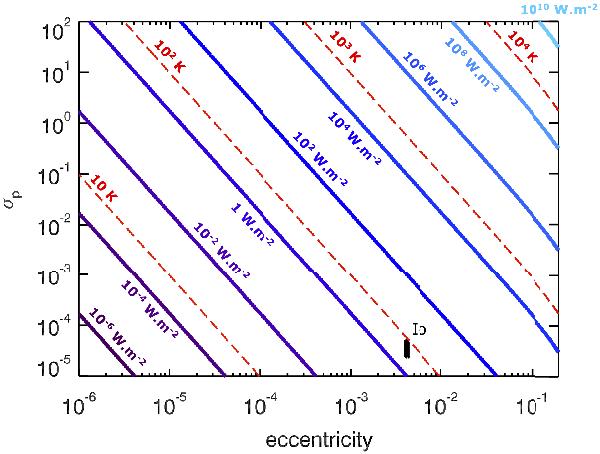
Map representing contours of the average surface heat flux φtides, as a function of eccentricity and planetary dissipation factor. From left to right the full lines correspond to a flux of 10-6, 10-4, 10-2 1, 102, 104, 106, 108, 1010 W m-2. The long dashed lines correspond to a temperature  of 10, 102, 103 and 104 K. The observed value of φtides on Io, 2.4–4.8 W m-2 (Spencer et al. 2000), is indicated in black for its estimated eccentricity value of 4.3 × 10⁻³ (Murray & Dermott 1999).
Current usage metrics show cumulative count of Article Views (full-text article views including HTML views, PDF and ePub downloads, according to the available data) and Abstracts Views on Vision4Press platform.
Data correspond to usage on the plateform after 2015. The current usage metrics is available 48-96 hours after online publication and is updated daily on week days.
Initial download of the metrics may take a while.