Fig. 3
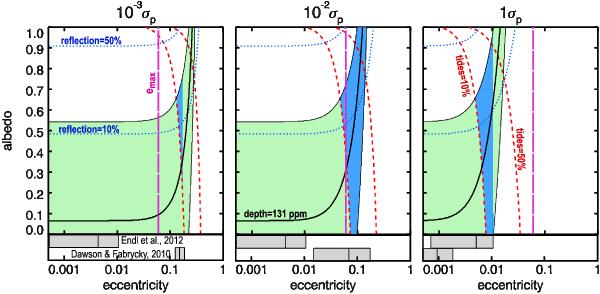
Contraints on albedo and eccentricity from the secondary eclipse depth, in the case of an airless planets. The light green shaded areas are in agreement with the 131 ± 28 ppm depth measured with Spitzer/IRAC2 by D12. The right hand side plot is for an Earth-like dissipation constant σp; the left and middle plots are for 10-3 × σp and 10-2 × σp, respectively. The dotted (resp. dashed) lines indicate where reflection (resp. tidal dissipation) accounts for 10 and 50% of the planetary flux (reflection + thermal re-emission + tides = 100%). The long dashed pink vertical line represents the observational constraint on the eccentricity given by D12. Horizontal grey bars below the graphs indicate the range of eccentricities found with the dynamical simulations described in Sect. 3.2. The upper and lower bars correspond to initial orbital elements from Endl et al. (2012) and Dawson & Fabrycky (2010), respectively. The maximum and mean values of the eccentricity are indicated, as well as the minimum when larger than 5 × 10⁻⁴. The blue areas are in agreement with the transit depth, the condition that tides accounts for more than 10% of the planetary flux and compatible with an eccentricity within the range found with the dynamical simulations. For 10-3 × σp and 10-2 × σp the agreement is met for simulations of Dawson & Fabrycky (2010) while for 1 × σp the agreement is met for Endl et al. (2012).
Current usage metrics show cumulative count of Article Views (full-text article views including HTML views, PDF and ePub downloads, according to the available data) and Abstracts Views on Vision4Press platform.
Data correspond to usage on the plateform after 2015. The current usage metrics is available 48-96 hours after online publication and is updated daily on week days.
Initial download of the metrics may take a while.