Fig. 10
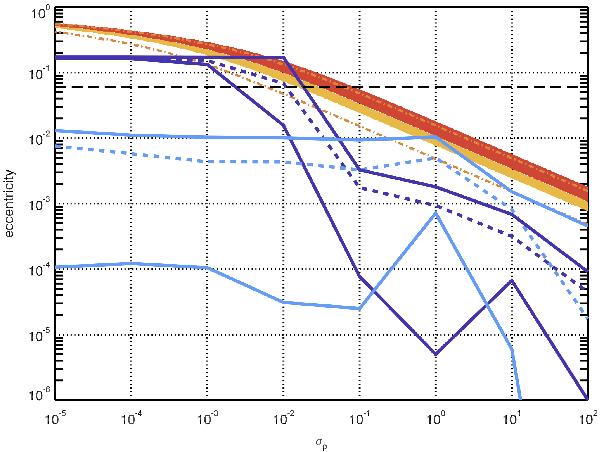
Eccentricity vs dissipation. The thick colored lines corresponds to the minimum, average and maximum eccentricity – bottom full line, middle dashed line and top full line – of 55 Cnc e obtained with the simulations of Dawson & Fabrycky (2010) in purple, and Endl et al. (2012) in blue. The horizontal black dashed line corresponds to the upper limit from observations (e = 0.06, D12). The color bands correspond to the region where the two conditions of Eq. (5) are met: where the tides contribute to more than 10% of the planet’s flux and where the resulting transit depth is between the observational constraints. The light orange band corresponds to an albedo of 0 and the red one to an albedo of 1. The orange dashed dotted lines delimit the band corresponding to an albedo of 0.65.
Current usage metrics show cumulative count of Article Views (full-text article views including HTML views, PDF and ePub downloads, according to the available data) and Abstracts Views on Vision4Press platform.
Data correspond to usage on the plateform after 2015. The current usage metrics is available 48-96 hours after online publication and is updated daily on week days.
Initial download of the metrics may take a while.