Fig. 6
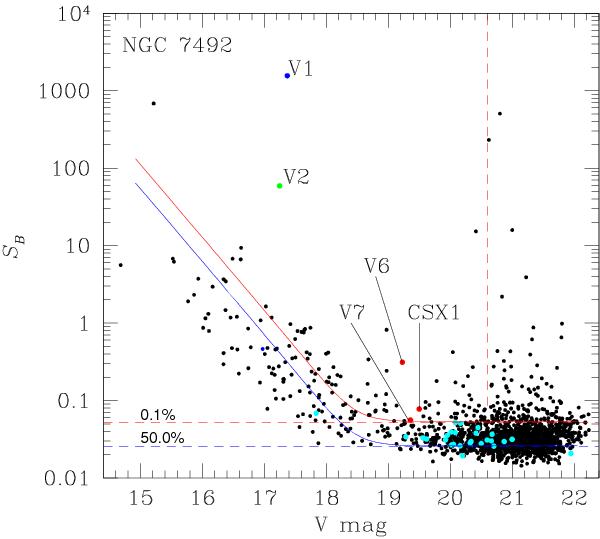
 statistic as a function of V mean magnitude for the VR combined light curves. The RR Lyrae stars V1 and V2 are labelled, as are the new SX Phe stars V6 and V7 and the one candidate SX Phe star. The cyan points correspond to the blue stragglers identified by Cote et al. (1991). The long-period variables V4 and V5 do not appear on this plot because they are saturated in the R filter. The solid blue curve is the median (50%) curve determined from our simulations and adjusted to fit the real data above V ~ 19 mag. The dashed red curve represents our variable-star detection threshold in set using our simulations to limit our false-alarm rate to ~0.1%. The solid red curve represents our adopted variable star detection threshold when we take into account the systematic errors. We additionally limited our variable-star search to stars brighter than V = 20.6 mag (vertical dashed red line).
Current usage metrics show cumulative count of Article Views (full-text article views including HTML views, PDF and ePub downloads, according to the available data) and Abstracts Views on Vision4Press platform.
Data correspond to usage on the plateform after 2015. The current usage metrics is available 48-96 hours after online publication and is updated daily on week days.
Initial download of the metrics may take a while.