Fig. 13
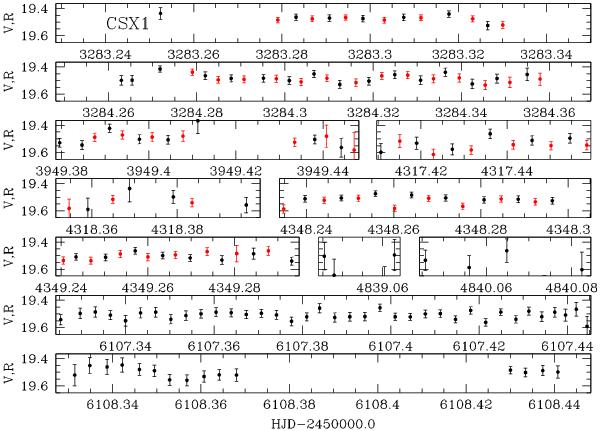
Light curve of the candidate SX Phe star CSX1. Black points correspond to the V magnitudes and red points correspond to the R magnitudes (which are shifted in mean magnitude to match the mean magnitude of the V data). Some data points fall outside of the plot magnitude range.
Current usage metrics show cumulative count of Article Views (full-text article views including HTML views, PDF and ePub downloads, according to the available data) and Abstracts Views on Vision4Press platform.
Data correspond to usage on the plateform after 2015. The current usage metrics is available 48-96 hours after online publication and is updated daily on week days.
Initial download of the metrics may take a while.