Free Access
Fig. 3
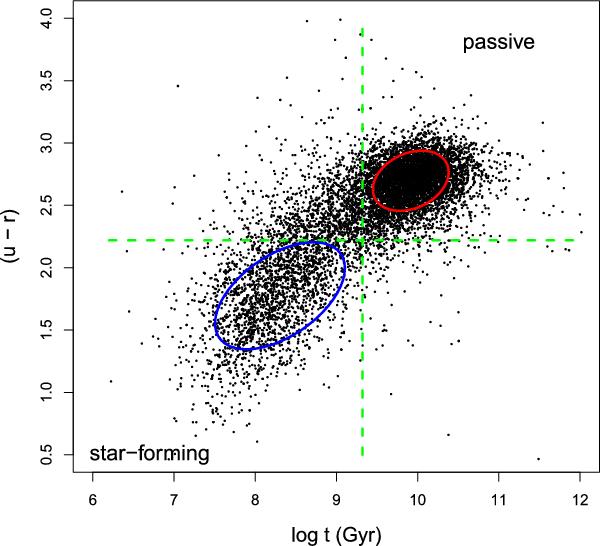
Bimodal distribution of galaxies in the color-age diagram showing the 1σ ellipse around the star-forming (blue) and passive (red) peaks. The horizontal and vertical green dashed lines indicate the red/blue and star-forming/passive separations, respectively.
Current usage metrics show cumulative count of Article Views (full-text article views including HTML views, PDF and ePub downloads, according to the available data) and Abstracts Views on Vision4Press platform.
Data correspond to usage on the plateform after 2015. The current usage metrics is available 48-96 hours after online publication and is updated daily on week days.
Initial download of the metrics may take a while.