Free Access
Fig. 1
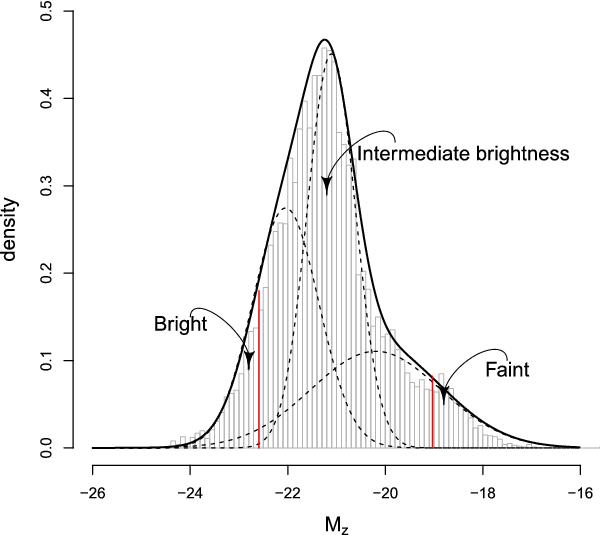
Gaussian mixture model for the Mz distribution. Dashed lines depict the individual components. The vertical red lines mark the intervals for these modes: Mz < − 22.59 for the bright population, Mz > − 19.03 for faint population, and intermediate values of Mz for the intermediate brightness population of galaxies.
Current usage metrics show cumulative count of Article Views (full-text article views including HTML views, PDF and ePub downloads, according to the available data) and Abstracts Views on Vision4Press platform.
Data correspond to usage on the plateform after 2015. The current usage metrics is available 48-96 hours after online publication and is updated daily on week days.
Initial download of the metrics may take a while.