Free Access
Fig. 14
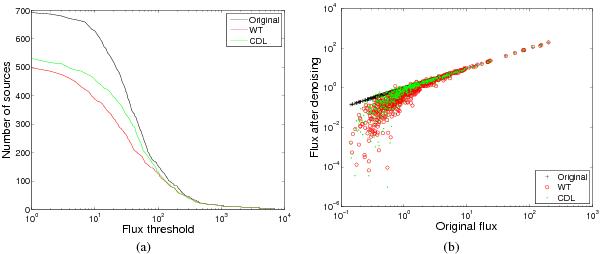
Source photometry comparison between CDL and wavelet denoising: a) number of sources with a flux above a varying threshold after denoising; and b) how the flux is dampened by denoising, representing the source flux after denoising as a function of the source flux before denoising.
This figure is made of several images, please see below:
Current usage metrics show cumulative count of Article Views (full-text article views including HTML views, PDF and ePub downloads, according to the available data) and Abstracts Views on Vision4Press platform.
Data correspond to usage on the plateform after 2015. The current usage metrics is available 48-96 hours after online publication and is updated daily on week days.
Initial download of the metrics may take a while.