Fig. 13
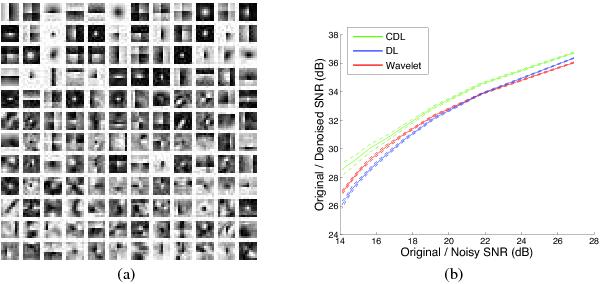
Benchmark for Abell 1689 image from Fig. 8 comparing CDL to DL and wavelet denoising methods: a) a centered learned dictionary that was learned on a second, noiseless image and used for denoising; b) the peak S/N curve for the three methods. Centered dictionary learning method is represented by the green curve, the classic dictionary learning in blue and the wavelet-based method in red. The horizontal axis represents the peak S/N (dB) between the image before and after adding noise. For denoising, we use OMP with a stopping criterion fixed depending on the level of noise that was added. 100 experiments were repeated for each value of noise.
Current usage metrics show cumulative count of Article Views (full-text article views including HTML views, PDF and ePub downloads, according to the available data) and Abstracts Views on Vision4Press platform.
Data correspond to usage on the plateform after 2015. The current usage metrics is available 48-96 hours after online publication and is updated daily on week days.
Initial download of the metrics may take a while.