Fig. 4
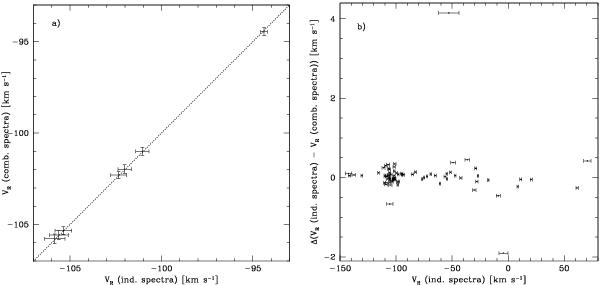
a) Comparison of radial velocities for the HB/RGB-UVES stars derived from the combined spectrum (y-axis) and from the up to twenty individual spectra separately and then averaged (x-axis). Errorsbars refer for the y-axis to errors as estimated by iraf (see text) and for the x-axis to the σ around the mean. The dotted line shows the one-to-one relation. b) Shows the difference between the radial velocities for RGB-FLAMES stars derived from the up to twenty individual spectra separately and averaged and the radial velocities derived from the combined spectra as a function of the radial velocities derived from the individual spectra and averaged. We only show the errorsbars for these values as they are by far the largest. N.B. The radial velocities based on the individual spectra are shown before the culling leading to the final radial velocities shown in Table 5.
Current usage metrics show cumulative count of Article Views (full-text article views including HTML views, PDF and ePub downloads, according to the available data) and Abstracts Views on Vision4Press platform.
Data correspond to usage on the plateform after 2015. The current usage metrics is available 48-96 hours after online publication and is updated daily on week days.
Initial download of the metrics may take a while.