Fig. 9
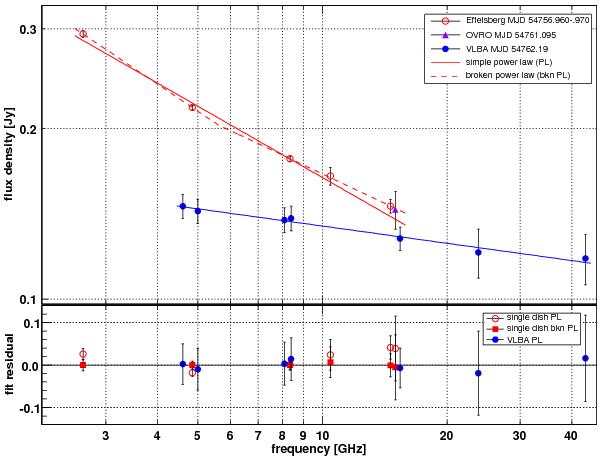
Top panel: radio spectrum of 1ES 2344+514 measured quasi-simultaneously by Effelsberg, OVRO and VLBA. The VLBA points represent integrated flux densities. The solid lines illustrate fits with a simple power law, the dashed line shows a broken power law fit. Bottom panel: fit residuals, which are the differences between the measured flux densities and the fit values divided by the flux density values. See also footnote 11.
Current usage metrics show cumulative count of Article Views (full-text article views including HTML views, PDF and ePub downloads, according to the available data) and Abstracts Views on Vision4Press platform.
Data correspond to usage on the plateform after 2015. The current usage metrics is available 48-96 hours after online publication and is updated daily on week days.
Initial download of the metrics may take a while.