Fig. 5
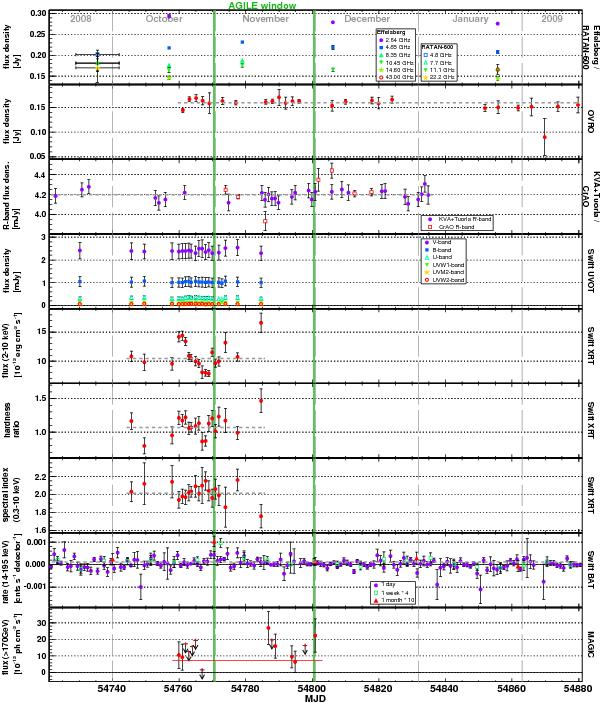
Combined 1ES 2344+514 multi-wavelength light curve derived from this campaign. The observation window of AGILE is shown by the vertical solid green lines. Horizontal short-dashed lines represent fits with a constant to the data points. In the R-band, the fit is being applied to the combined KVA and CrAO data points. Hardness ratio is defined as the event counts between 2−10 keV divided by the counts between 0.2−1 keV. The Swift BAT data are shown for several bin widths some of which have been multiplied by a factor for clarity as indicated in the panel legend. The fit shown in the BAT panel has been calculated for the 1 week binning. One point from the daily BAT light curve (MJD 54 867.5, rate − (6.08 ± 3.49) × 10-3 cnts s-1 detector-1) is not shown for clarity of the plot. The red solid line in the MAGIC panel gives the overall measured flux during the campaign. See text for details.
Current usage metrics show cumulative count of Article Views (full-text article views including HTML views, PDF and ePub downloads, according to the available data) and Abstracts Views on Vision4Press platform.
Data correspond to usage on the plateform after 2015. The current usage metrics is available 48-96 hours after online publication and is updated daily on week days.
Initial download of the metrics may take a while.