Fig. 3
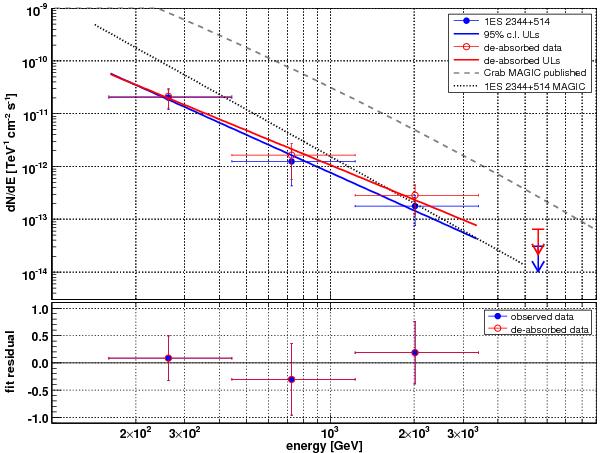
Top panel: measured (blue, filled circles) and de-absorbed (red, open circles) MAGIC spectra for 1ES 2344+514, shown together with the MAGIC 2005 spectrum of 1ES 2344+514 (Albert et al. 2007b) as well as the MAGIC Crab spectrum (Albert et al. 2008). Upper limits were derived with a c.l. of 95%. Bottom panel: fit residuals defined as the difference between flux and fit divided by the flux value.
Current usage metrics show cumulative count of Article Views (full-text article views including HTML views, PDF and ePub downloads, according to the available data) and Abstracts Views on Vision4Press platform.
Data correspond to usage on the plateform after 2015. The current usage metrics is available 48-96 hours after online publication and is updated daily on week days.
Initial download of the metrics may take a while.