Fig. 14
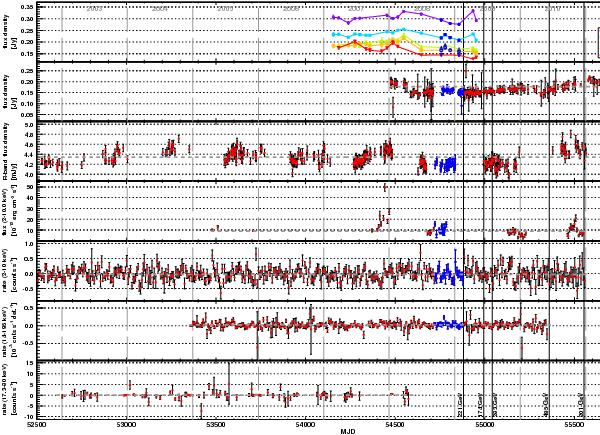
Long term light curves of 1ES 2344+514 measured by Effelsberg, OVRO, KVA+Tuorla, Swift XRT, RXTE ASM, Swift BAT and INTEGRAL ISGRI. The first four panels show an observation-wise binning (<1 day), the last three panels have been re-binned to weekly scales. The blue points mark the MJD range shown in Fig. 5. The lines in the top panel do not result from a fit but simply connect the data points. Horizontal short-dashed lines give fits with a constant. The black solid vertical lines denote the arrival time of LAT events >100 GeV. The ASM light curve has been cut at 01/01/2011. For clarity, two points of the BAT light curve are not shown (MJD 54 177.5, rate (2.26 ± 0.91) × 10-3 cnts s-1 per detector; MJD 54 541.5, rate (3.16 ± 1.82) × 10-3 cnts s-1 per detector) and the (linear) error bar of one point (MJD 53 729.5) has been cut at the plot edge. Distribution histograms of the light curve points over their respective errors are given in Fig. A.3. See text for details.
Current usage metrics show cumulative count of Article Views (full-text article views including HTML views, PDF and ePub downloads, according to the available data) and Abstracts Views on Vision4Press platform.
Data correspond to usage on the plateform after 2015. The current usage metrics is available 48-96 hours after online publication and is updated daily on week days.
Initial download of the metrics may take a while.