Fig. 1
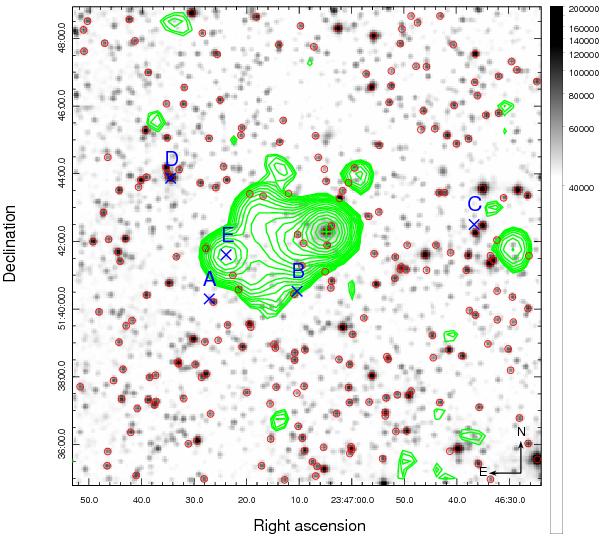
Sky map of the region around 1ES 2344+514 (marked by a green cross). Green radio contours at 1.4 GHz are overlaid on an R-band image. IR point sources are indicated by red circles. An “X” and its label mark individual components identified by Chandra (Donato et al. 2003). The logarithmic grey scale shows scaled densities. Radio contours are given from 0.001 Jy/beam to 0.241 Jy/beam in 20 logarithmically scaled steps. Only IR sources of J magnitude <15 are displayed. Data reference: X-rays: Donato et al. (2003); optical: DSS2red; IR: 2MASS; radio: NVSS, obtained from NED.
Current usage metrics show cumulative count of Article Views (full-text article views including HTML views, PDF and ePub downloads, according to the available data) and Abstracts Views on Vision4Press platform.
Data correspond to usage on the plateform after 2015. The current usage metrics is available 48-96 hours after online publication and is updated daily on week days.
Initial download of the metrics may take a while.