Fig. 8
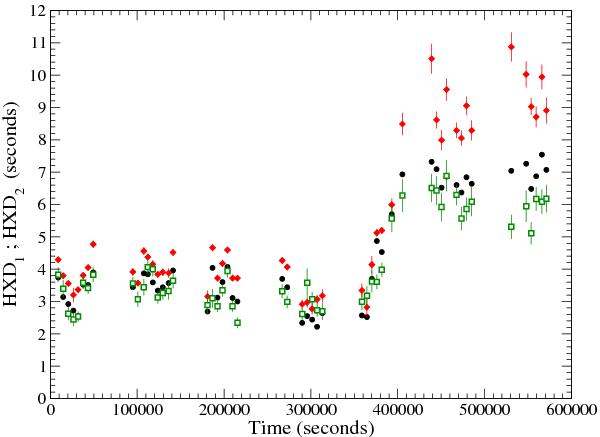
Evolution of the HXDs, measured by means of the various methods, between the count rate and the mean energy data series during the entire time interval: results from the direct method are red diamonds (HXD1) and green open squares (HXD2). Black filled circle are the HXD values obtained from the cross-correlation method. The rather sharp increase from the interval II to III (360 000 to 400 000 s), after the irregular mode,corresponds to an increase in the mean count rate (see Paper I).
Current usage metrics show cumulative count of Article Views (full-text article views including HTML views, PDF and ePub downloads, according to the available data) and Abstracts Views on Vision4Press platform.
Data correspond to usage on the plateform after 2015. The current usage metrics is available 48-96 hours after online publication and is updated daily on week days.
Initial download of the metrics may take a while.