Fig. 7
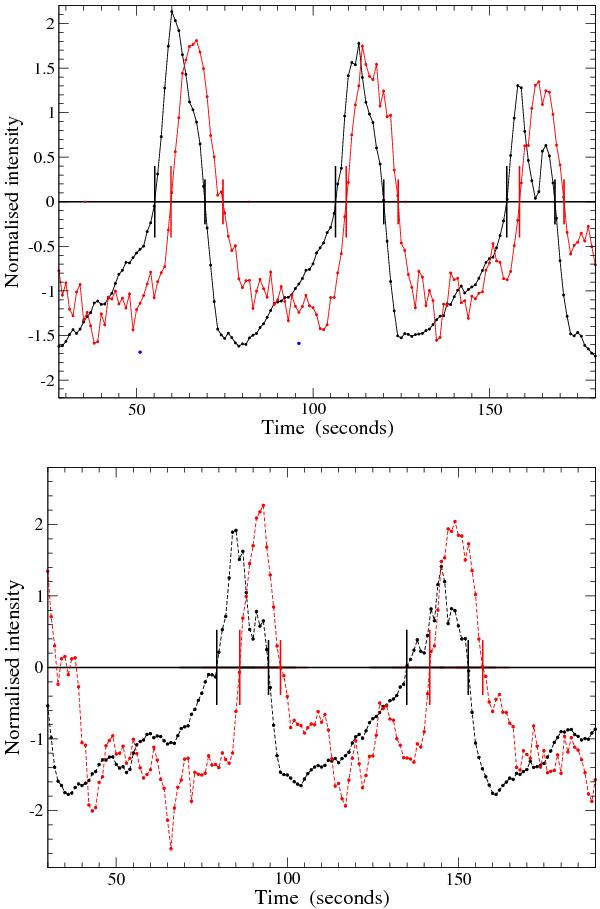
Upper panel: a segment of the A8b series illustrating how HXDs are evaluated in single bursts. Black and red data are the count rate and mean energy series, respectively. The zero level corresponds to the values of the centroid of the ellipse in the CR − E plot. Long and short vertical bars mark the time intervals of HXD1 and HXD2, respectively. Lower panel: a segment of equal duration of the F7 series. We note that both HXDs are longer than in the A8b series.
Current usage metrics show cumulative count of Article Views (full-text article views including HTML views, PDF and ePub downloads, according to the available data) and Abstracts Views on Vision4Press platform.
Data correspond to usage on the plateform after 2015. The current usage metrics is available 48-96 hours after online publication and is updated daily on week days.
Initial download of the metrics may take a while.