Fig. 6
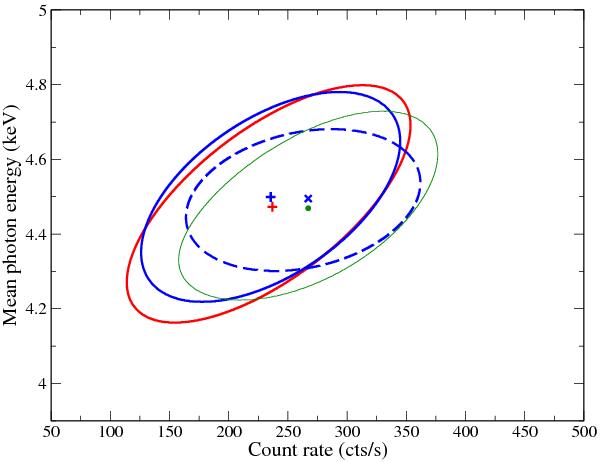
Best-fit ellipses of the mean trajectories in the CR-E plane of the A8b (blue solid line), E5 (red solid line), and F7 (blue dashed line) series, showing the change of the shape, orientation, and location of the centre of the ellipse of the last data series with respect to the previous two. The green ellipse is computed from that of the A8b by increasing the count rate by the difference between the mean values with the F7 series and assuming that the mean energy of this component was unchanged, equal to 4.25 keV, as the typical BL value.
Current usage metrics show cumulative count of Article Views (full-text article views including HTML views, PDF and ePub downloads, according to the available data) and Abstracts Views on Vision4Press platform.
Data correspond to usage on the plateform after 2015. The current usage metrics is available 48-96 hours after online publication and is updated daily on week days.
Initial download of the metrics may take a while.