Fig. 5
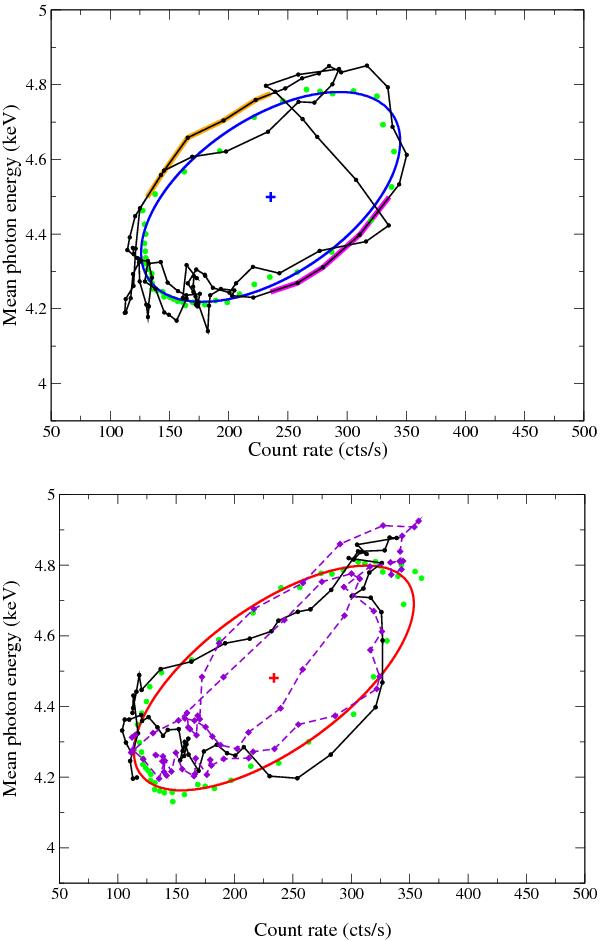
Trajectories in the CR-E plane of two subsequent individual bursts of the A8b (top panel) and E5 (bottom panel) time series. Green filled circles and blue and red ellipses are the mean trajectories and the best fits as in Fig. 4; black lines connecting consecutive points track individual bursts, with the exception of the first “anomalous” burst in the bottom panel plotted as a violet dashed line. In the upper panel the thick black portions of the line connecting data points mark the sections used to measure the HXD1 (magenta) and HXD2 (orange).
Current usage metrics show cumulative count of Article Views (full-text article views including HTML views, PDF and ePub downloads, according to the available data) and Abstracts Views on Vision4Press platform.
Data correspond to usage on the plateform after 2015. The current usage metrics is available 48-96 hours after online publication and is updated daily on week days.
Initial download of the metrics may take a while.