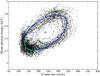
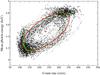
Fig. 4
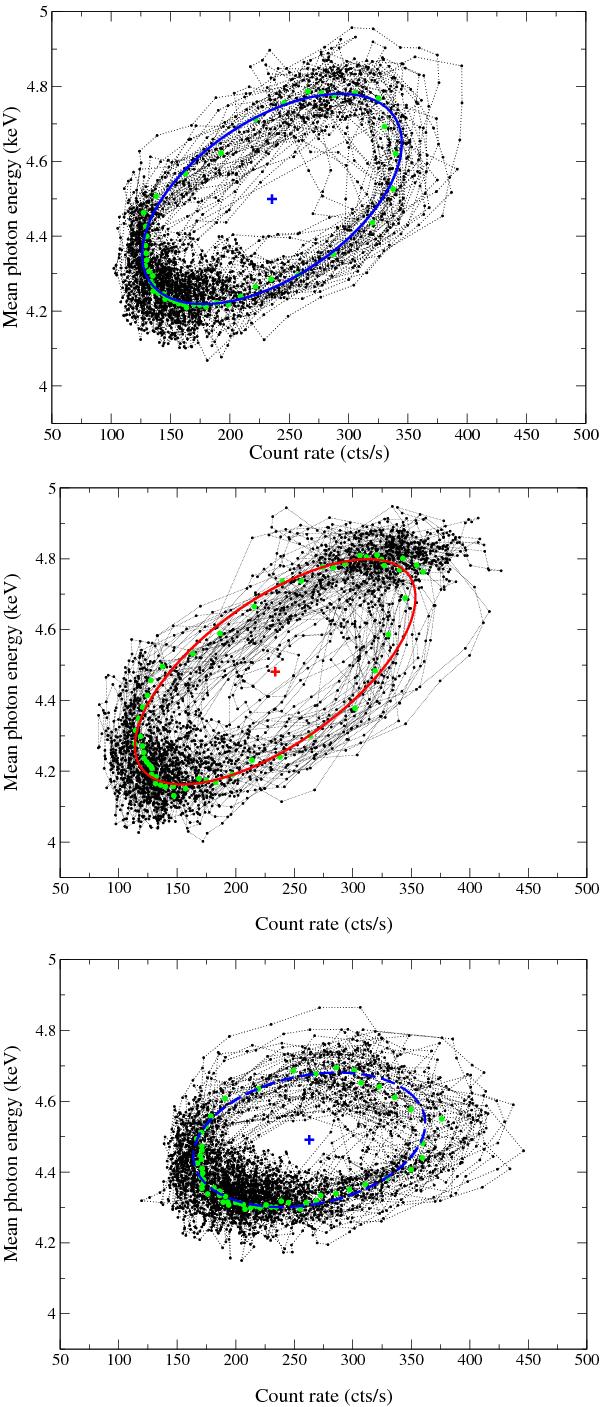
Trajectories for the data of the A8b (top panel), E5 (central panel), and F7 (bottom panel) time series in the CR-E plane. Dotted lines connect consecutive data points, the green dots are the mean values in the set of angular sectors along the loop, and thick lines are their best fit ellipses, computed as described in the text; crosses mark the centroids of the trajectories.
Current usage metrics show cumulative count of Article Views (full-text article views including HTML views, PDF and ePub downloads, according to the available data) and Abstracts Views on Vision4Press platform.
Data correspond to usage on the plateform after 2015. The current usage metrics is available 48-96 hours after online publication and is updated daily on week days.
Initial download of the metrics may take a while.